Base (non-annotated) Charts Courtesy of Genesis Trade Navigator.
Monthly Chart Comment as of Friday May 15, 2025: Pre-Dawn
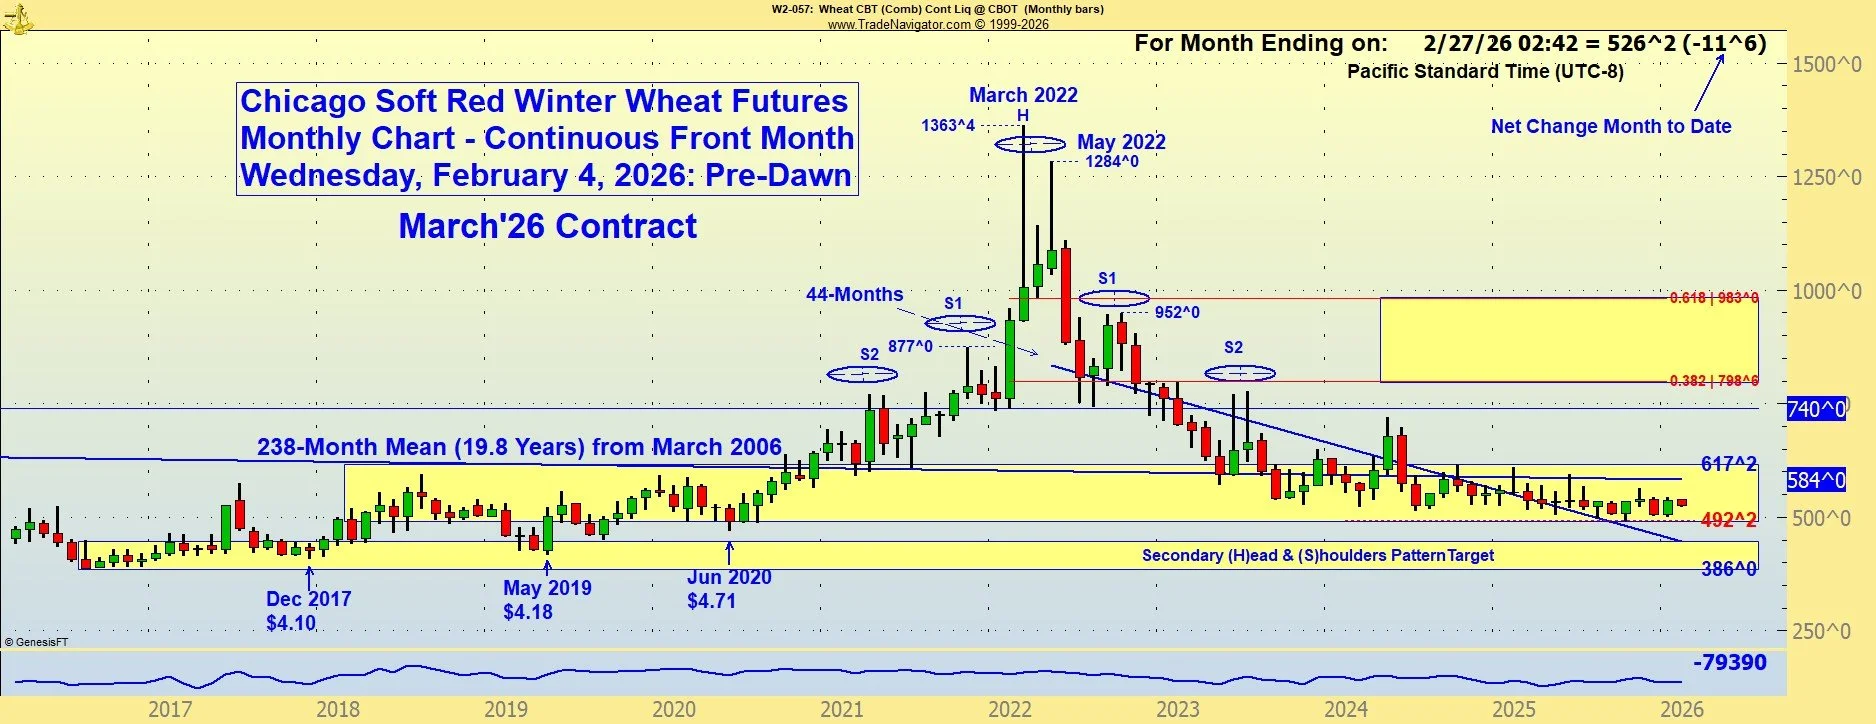
This chart is showing the long-term potential ranges. The engagement of the very large “Head and Shoulders” pattern has dominated this chart since it was first identified in the spring of 2024. Please observe the daily comment for May 15, 2025. It will be preserved in the “Previous Updates” once it rolls off the first page in “Market Bullet Points”.
In March of 2023 we wrote: Chicago Soft Red Winter (SRW) long-term chart illustrates an example of the well-known “Head and Shoulders” pattern, which began with the first “Shoulder” in 2021. The pattern yields a pair of downside price target ranges, one between $5.00-$6.00 which has technically been achieved, and an extended secondary range of approximately $3.00-$400. The targets are not generated as hard-number, precise ranges, but estimates based on historically similar patterns’ behavior over many past examples (see “Encyclopedia of Chart Patterns, 3rd Ed. 2021 by Thomas Bulkowski).
Now in mid-December of 2024, the pattern has yielded fruit. After the first neckline $7.40 broke, the next stop was at $5.97 - $6.00. The second neckline break below $6.00 gave us another opportunity to close out at $5.14 - $5.30. The downside is not completed, but appears to be exhausted. It took two years to unfold the entire $2.00 per bushel potential. Applying such a long-term pattern for wheat marketers (as opposed to pure speculators) would have translated into a more aggressive and earlier selling tendency. There are few speculators that have the patience to trade a 2-year position.
The problem with using a monthly chart pattern for trading is that the extremely long periods involved do not easily match reasonable capital requirements and the positions required require some potentially large capital maintenance. Still, identifying and tracking this provides a solid background of trend influence that adds significantly to confidence in shorter-timeframe actions.
The amount of time that the overall move down will require to stage a retracement appeared to be years from the writing of the original commentary (December 2022) through the crop to be harvested in 2024. The broad brush fundamentals, i.e. global and domestic Stocks-to-Usage ratios, are deemed “tight”, but the amount of wheat for sale in global markets remains abundant, and the U.S. Dollar, although still paused in its abiding uptrend, is likely to continue gaining strength, especially if war continues to dominate global perspective.
Vladimir Putin’s Russia will continue to push wheat into the export arena at discounted prices. Although the Russian administration has argued for better banking access for export operations while blaming the low prices on sanctions, it is not clear at all that wheat prices would benefit from easier export sales from Russia.
The Long-term (20-month) trend in Chicago Soft Red Winter (SRW) wheat is lower.
*** Decisions within those boundaries will likely be better served with shorter-term charts. ***
* A “Front-month” futures chart always shows the leading contract in time. Each time the calendar approaches the expiration of any trading contract (the end of November for the December contract), the trade “rolls” any positions intended to be held beyond the currently expiring period to the next month (or farther) out. In the case of the now-expired December contract, the next month trading became March’24. This “roll-out” usually occurs about two weeks or so ahead of the “first notice day” for delivery of an expiring contract. There is no rule or set calendar day for this activity, but contract liquidity is essential, so most position managers will begin to shift contract months well before expiration. For U.S.-based futures, there are 5 annual contracts trading for each calendar year: March, May, July, September and December. Please use the “contact us” form or call for questions regarding market structure.
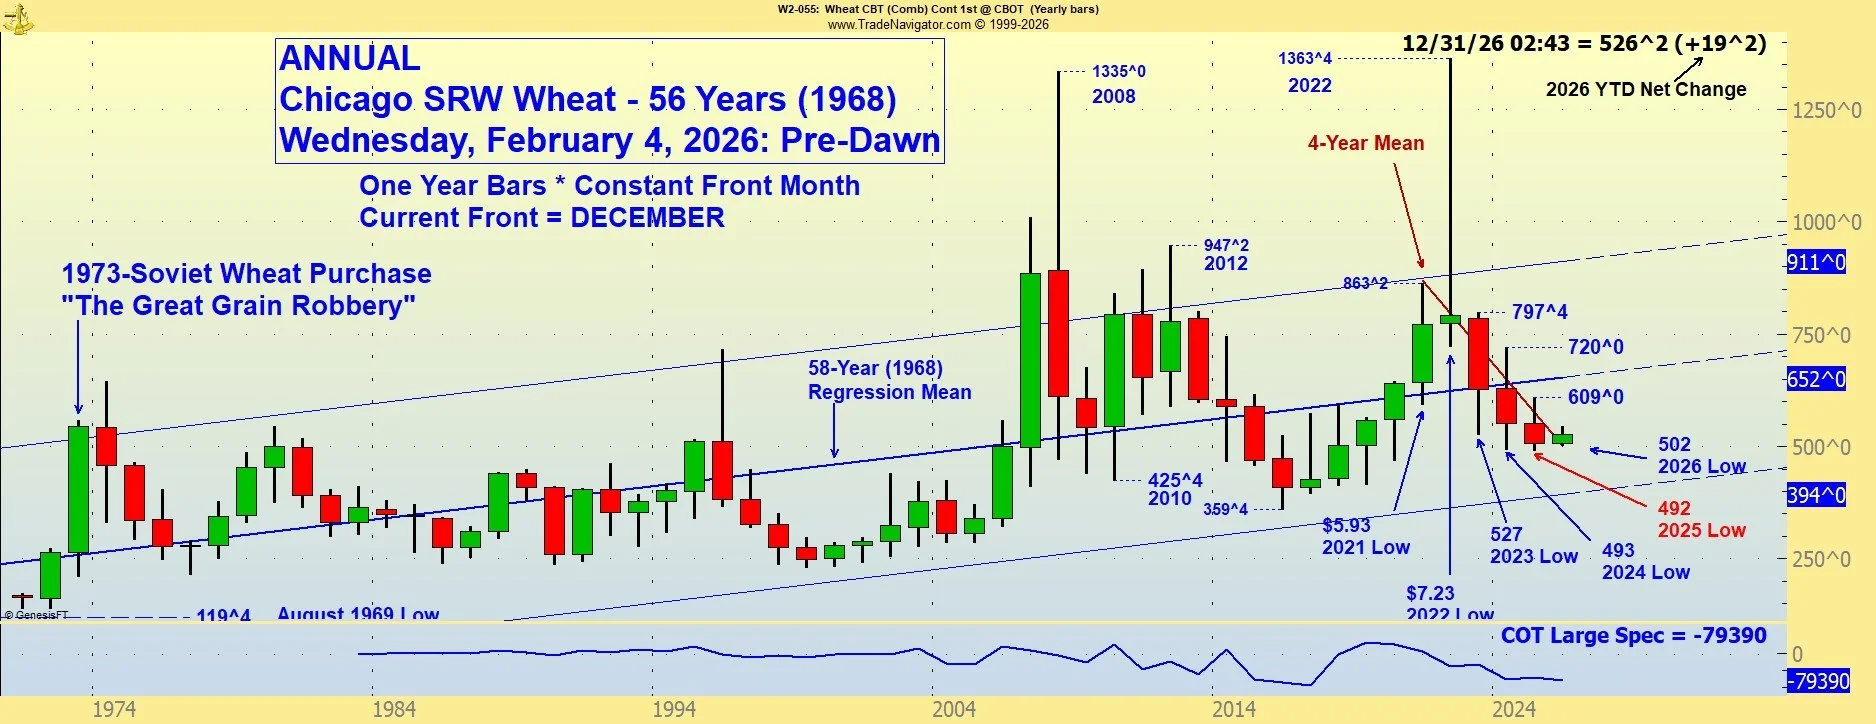
Market Bullets® ANNUAL CHART as of Tuesday, February 3, 2026: Close
2021 plus $1.31 per bushel ($.93 below highest point that year)
2022 minus $.21 ($5.71 below its highest point - March ‘24)
2023 minus $1.64 ($5.71 below highest point)
2024 YTD Minus $.76 at $ 5.51 (YTD HIGH point of $7.16 3/4 on May 24)
2025 YTD MINUS $.44 at $5.07, $1.02 below the YTD High and $.15 above the YTD low.
2026 YTD Plus $.22 at $5.29
The big, multi-decade trend channel in the 56-year annual chart of Chicago Soft Red Winter (SRW) wheat is positive, although the war-driven highs of 2022 interrupted an 18-year negative retracement off of the 2008 peak (caused by a global weather-induced wheat supply shortage coupled with a weak U.S. Dollar). The market is still well within the multi-decade “normal” trend channel. To disrupt this massive, positive trendline channel on the downside, wheat would have to trade below $3.93 in the front month futures contracts. The odds of such a failure remain small, although the last 3 years of trade have eroded the cushion to less than 15 cents from the low of 2024 at $4.93, the failure of which would confirm the negative trend that lies within the multi-decade upward bias channel.
It is very difficult to actually trade using such a long-term pattern. The moves take so long, and the variability of the price is so high between swings, that for most it is useful only as a background study of the market.
This chart normally does not reflect any tradeable, operationally practical change in trend until long after most trading opportunities to sell or exit are past. For now, this serves only as a reminder that the 55-year trend is positive, but the swings are years or decades in development. Who can stay in a position so long? There is always a high likelihood of “reversions” to the mean. Short-term decisions using such a long-term chart are not appropriate. It serves only the purpose of providing a background to shorter-term work.
The largest volatility factors for wheat prices are geo-political economics, If it were not for the shadow of a megalomaniacal Russian escapee from the Cold War of the 60’s, we would be seeing the global wheat markets even more dominated by massive Russian/Ukrainian crops, something we should prepare to see in the future, no matter who is in charge of Black Sea ports.
The state of anxiety remains high among many governments of both importing and exporting countries, although the specter of “Food Protectionism”, in which many governments slowed or halted wheat and other ag food exports, has receded into the background. Putin has indicated that he is not interested in any program involving exports from Ukraine unless he benefits in some way, apparently mostly an easing of the sanctions hampering his own exports of grains and fertilizer. Russia is still working on a giant crop for sale. Ukrainian wheat production is a fraction of what it would be in peacetime, but continues to work vigorously to move exports with or without Black Sea origins. The end of war in Ukraine will be a wheat market price-negative factor.
Chart studies, seasonal cycles, ratio measurements and other “technical” tools are useful in such markets, but most are best used to measure, test and confirm trend dimensions and are less often appropriate as hard trade signals. We will develop more detail on this approach in this space. We value your perspective. Please send us your thoughts on this matter via the “contact us” button in the top menu for this site.
MarketBullets® commonly uses “candlestick” charting. Each vertical candle represents one, three-month calendar quarter, with red for negative periods and green for positive. For each green candle, the first (opening) price traded for the period is the bottom of the colored part of the bar, while the final price traded is at the top. The opposite is true for red candles, with the opening price at the top and closing at the bottom. The black lines extending from the top and/or bottom of any candle represent prices traded at times between the opening and closing prices. The style is known as a “Candlestick” chart and makes an easy and intuitive visual presentation for price movement charts and can be expressed in any time period from minutes per candle to years or more.


